Calculating the Full Cost of a Hardware Product

Every now and then, articles get released stating how much higher the prices of products are than the cost of the parts that go into them. Most of these are based on woefully incorrect estimates, but they also ignore the full cost of bringing a product into market. As a consumer, it’s illuminating to dig in further. If you’re the one building and selling products though, understanding the full cost of designing, manufacturing, selling, and supporting them is a matter of life and death for your company. The generic guidance is that a product should be sold for around 3x the cost of the materials, but in actual products that could range anywhere from 0.5x (the razor and blades model) to 10x (Veblen goods) depending on company strategy and cost structure and the market the product is in.
Regardless of the pricing strategy, the best way to understand costs is to build out a detailed model and start running through different cost, price, and volume scenarios early in the development process. There are some great guides on this from Ben Einstein and Andrew Huang. My general recommendation is to read as much material as you can and then distill it down into the specifics that are relevant to your product and business. In addition to providing one more reference point, I wanted to release a practical cost model in Google Sheets and Excel that you can start from.
Our cost calculator is broken down into manufacturing costs, financing costs, fulfillment costs, support costs, fixed costs, internal costs, and program inputs. This may sound like a lot of data, but each of these is only a high level placeholder to use for early modeling. By the time you’re ready to start selling a product, you should have a portfolio of highly customized and detailed spreadsheets with a range of scenarios modeled. For now, let’s step through the sections in the basic model one by one.
Manufacturing Costs
We’ll start with manufacturing costs, which are the most intuitive part of the cost of a product. This is the cost of the materials and labor required to make the product. You’ll need a detailed costed Bill of Materials (BOM) to feed into the calculator. You can reference Bunnie’s guide or a model that Dragon Innovation has made available. The BOM is made up of components, modules, royalties, consumables, packaging, and other materials, while the MVA refers to the Manufacturing Value Add of labor and manufacturer profit on the product. We also extend the model by considering yield and reworks. It would be extremely rare for a consumer electronics production line to output 100% perfect units. Typically a few percent (ideally decreasing over time) would have functional or cosmetic issues caught in testing and inspection, and would need to be “reworked” or repaired before they can be packed and shipped out. The output of this section is the amount of money paid per unit to the manufacturing partner at the Freight on Board (FOB) location, where you take ownership of the product inventory.
Financing Costs
Cost models often skip over financing, but this is an important part for a startup. It may be difficult to cover the cost of inventory entirely with cash on hand, so you may need an Inventory Line of Credit or similar type of loan to cover the time between payment being due to the supplier and receiving payment from a customer. This is a very basic financing model that uses simple interest and doesn’t account for differing payment terms to different suppliers, but it is a starting point you can extend on.
Fulfillment Costs
Now we start to get into the more obscure details of product cost, which are the costs of getting a unit from the FOB location to your customer’s doorstep. Note that this model only covers direct sale to the consumer and not retail sales.
First we’ll determine the logistics costs. This depends on the size and quantity of what you’re selling, but for consumer electronics, you would typically pack units together into a bigger box called a master carton and then stack together master cartons to fill a pallet. If you’re selling more or larger products, you may be handling container loads or if you’re selling fewer or smaller, you may do logistics at the master carton level, but we’ll stick with pallets for this model. Onpallet has a convenient calculator to estimate how many units can make up a pallet load. We then use Frieghtos to estimate the cost of getting a pallet from the FOB port to a port in the sales region by both air and sea, along with the truck or rail cost to go from the port to your fulfillment warehouse. Air is of course significantly more expensive and carbon intensive, but can cut 20-30 days off of the time to cross the Pacific Ocean. Carbon offsets from a non-profit like Carbonfund can help you mitigate the harm, but you should consider the air/sea split over time carefully. Companies often use air freight to accelerate a launch and then switch to sea as they are able to build up an inventory buffer.
The fulfillment partner, typically referred to as a Third Party Logistics (3PL) partner, will have additional costs you need to model around sorting and storing incoming goods as well as picking, scanning, and packing up the product to ship to the consumer. If you warehouse internally instead of using a 3PL, you’ll instead capture your staffing costs here. You will also need to capture the cost of shipping to consumers and the payment processing fees to be able to take payment from them. All of these will change from region to region, so your eventual model should include multiple fulfillment cost structures and a region split model.
Support Costs
Next, we need to consider the overall cost of supporting a product in the field. This includes remorse returns from consumers, warranty failures, and the staffing costs of your support team. Something to keep in mind is that returns and warranty failures shouldn’t be written off, but should be refurbished and brought back into the market. We include the average costs of refurbishing and the percent of original price for the refurbished unit in the model.
Fixed Costs
In addition to the range of per-unit costs, we have to consider the fixed manufacturing costs for the product. That includes development payments to the manufacturing and component partners, the costs of tooling and line equipment, and certifications. It also includes excess and obsolescence (E&O), which is the amount of material that goes unused when parts change or the product goes end of life. Note that many of these costs are not truly fixed, since tooling will wear out and your line costs may increase if you decide to increase manufacturing capacity.
Internal Costs
Finally, we have to consider the internal costs of developing and selling a product. Each of these rows can again come from a much more detailed model, but you can start with rough estimates.
Program Inputs
Against all of these, we have to state our inputs of sales price and volume. This is usually the most interesting place to start playing with different scenarios to determine what is needed to make a program break even and eventually profitable. Note that if you have multiple versions or SKUs of a product, you’ll want to build a more detailed calculator with SKU splits, BOM costs per SKU, and the added fixed costs per SKU.
Program Outputs
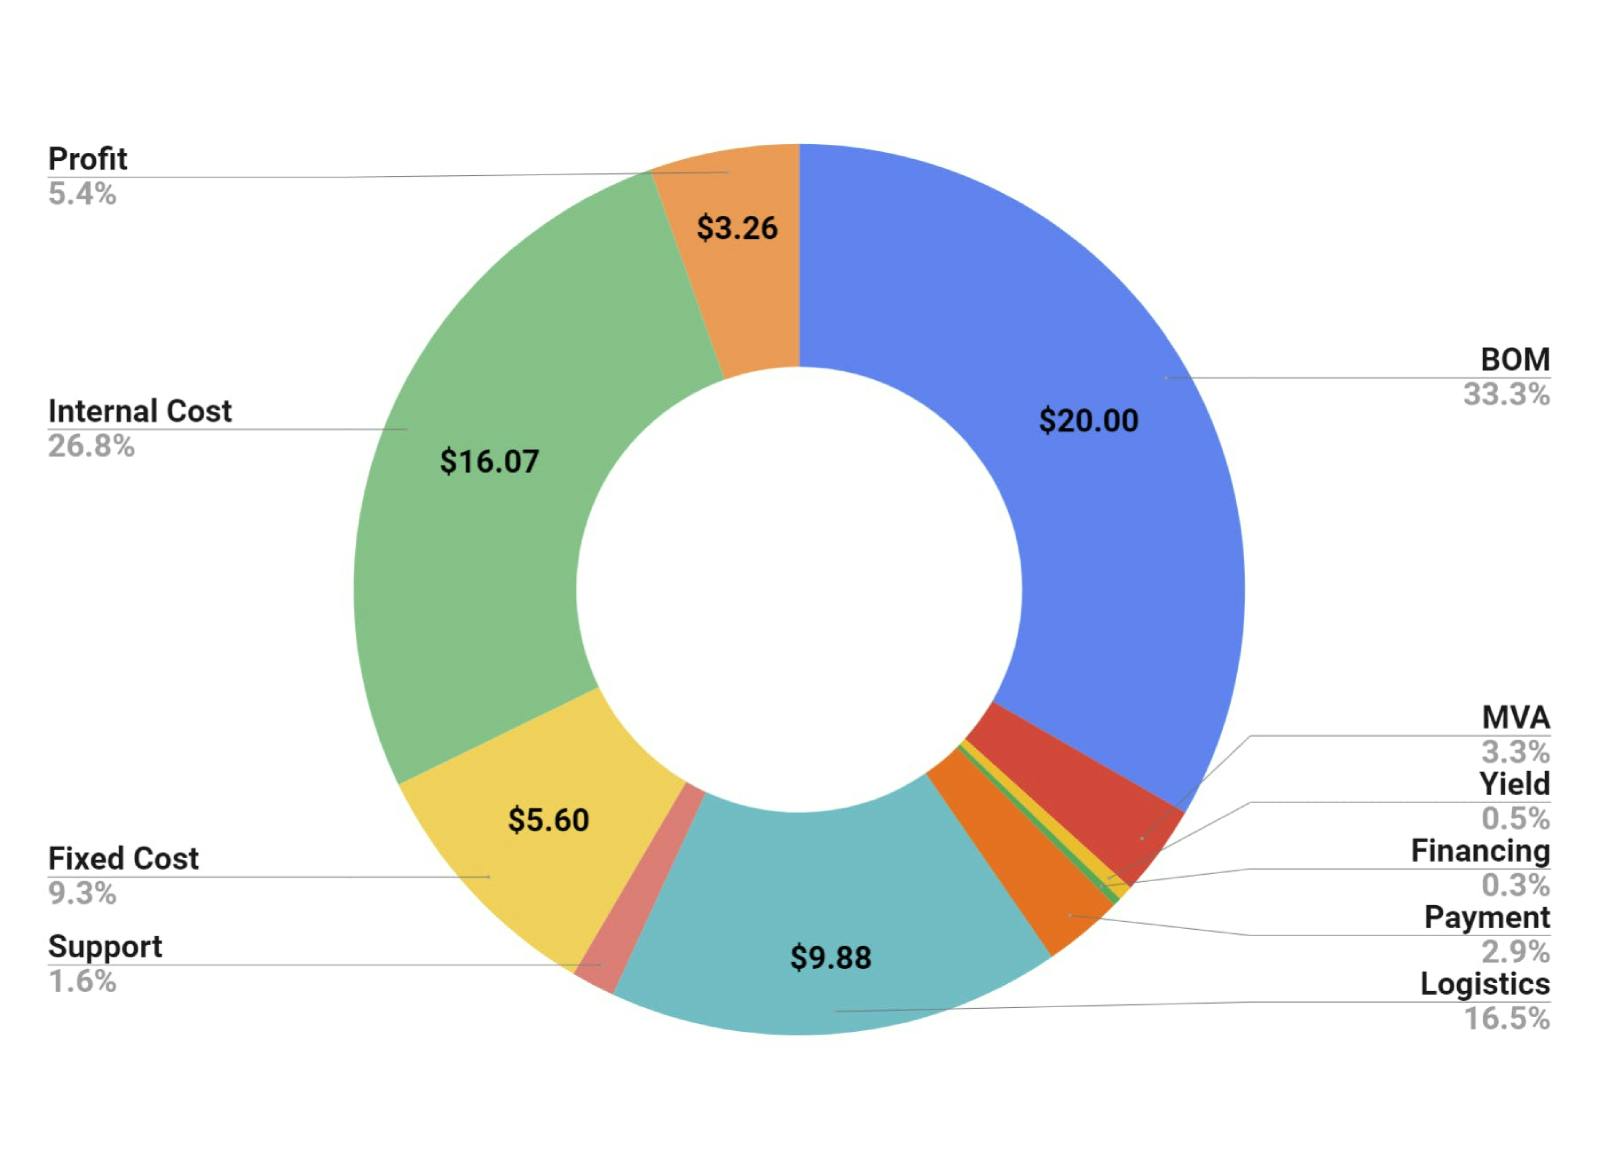
As you can see from our overall outputs, quite a lot more than the bare materials goes into the cost of a product. With a high level calculator in place, you can better understand what levers are most important to focus on for cost reduction.
What Now?
With a model in hand, you can start to do scenario analysis and sensitivity analysis. For scenario analysis, you can start by duplicating your data into new columns and adjusting some inputs to simulate different program scenarios. For example, you can create a range of columns that each have differing total sales volumes, which allows amortizing the fixed costs over more units and would generally also enable cost negotiation leverage in areas like the BOM and MVA. You can also sanity check trades between different buckets like BOM cost and internal development costs. As an example, you can check the volume at which it’s worth spending a few person-months of engineering time to save a dollar on a cheaper microcontroller.
It’s generally worthwhile to make some best-case and worst-case scenarios on volume and other inputs to see where you most need to focus for derisking a program. Sensitivity analysis is basically a method to formalize this and determine which inputs are most important for improving a target output, but it is outside the scope of this already very long blog post.
We hope this was a helpful starting point to understand product costs, and we’re happy to respond to any questions you have on it. We’ll plan to update the basic model as we get feedback over time to make it as useful as possible.
